For homes, schools, facilities and outdoor deployments
See the air. Understand the pattern. Act across every connected sensor.
A VisiblAir monitor measures your environment; the Cloud Portal brings supported devices together for remote readings, history and configured email alerts. Explore the real screens below before you choose a model.
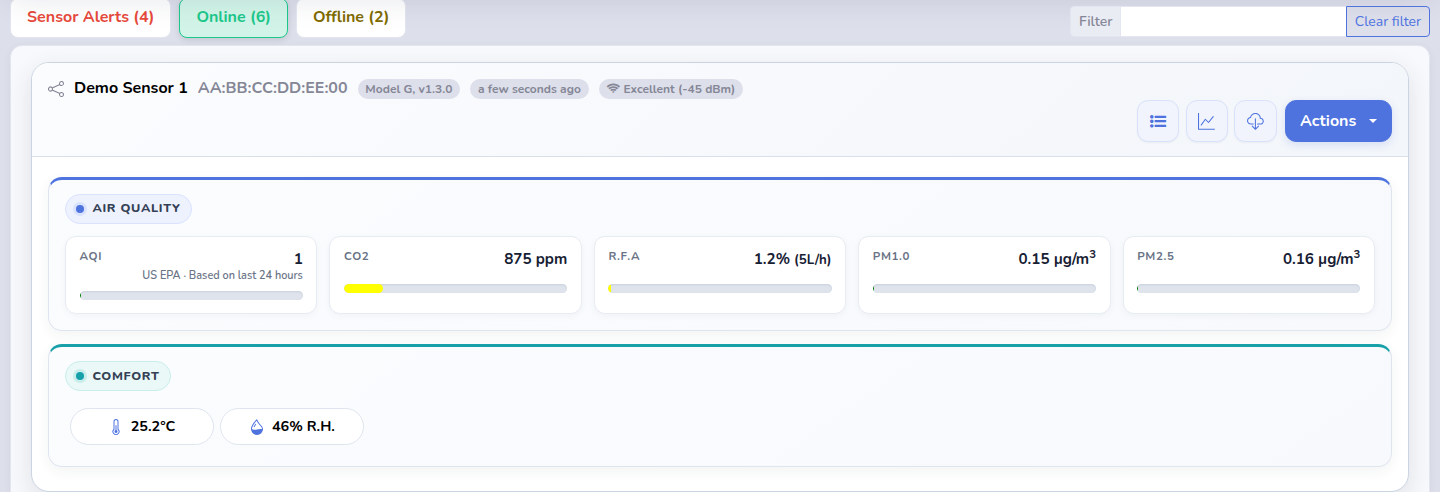
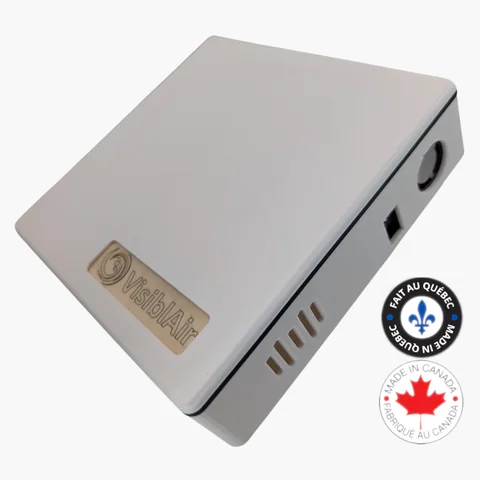
Representative portal screen with fictional sensor details; available measurements depend on the monitor.
From a live reading to a useful decision
One account can show several connected monitors. Filter online, offline and alert states, then open a sensor to inspect the measurements its hardware supports.
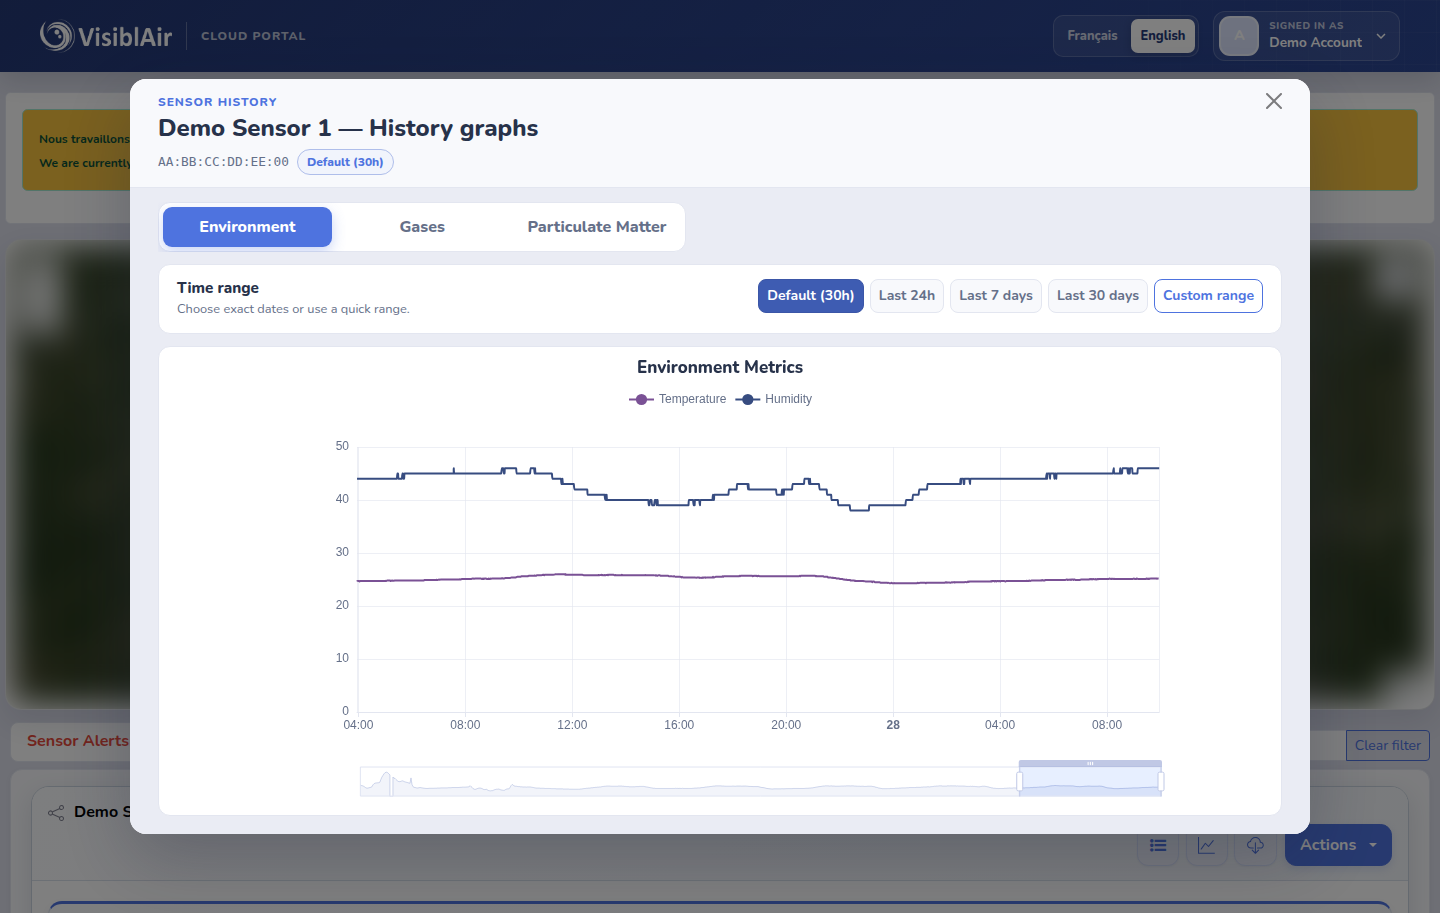
Find the moment that changed
Historical graphs offer 24-hour, 7-day and 30-day views and a custom range. Zoom and pan to inspect a ventilation change, a classroom schedule or an outdoor particulate event. The screenshot remains readable even if the tour cannot play.
Set alerts and manage locations
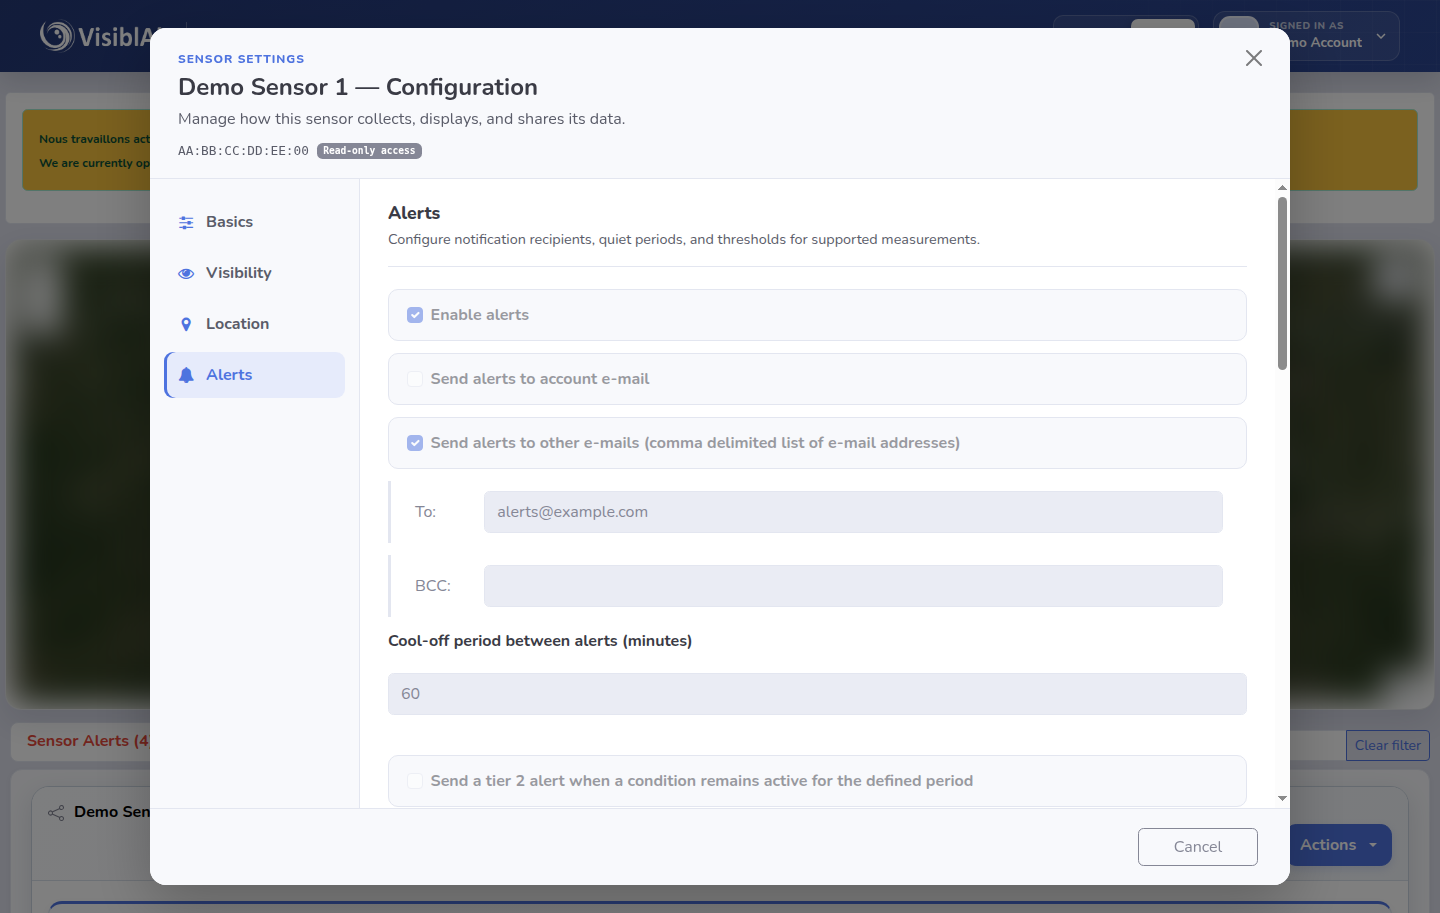
Configure above-or-below threshold email alerts per sensor, with recipient and repeat-message controls. A map view helps with several sites. Each sensor's public-map participation and public-view link are separate choices; a private sensor need not appear publicly.
Review alert setup and limitations · Explore the public sensor map
Local measurement and cloud access
Compatible connected models keep measuring and can store readings locally during a network interruption, then synchronize stored readings when connectivity returns. Local storage and offline behavior vary by model. Remote viewing, email alerts and cloud history require a working connection and portal access.
Model D and Model F are local-use monitors without Cloud Portal support; Model D exports a local CSV. Compare local and connected models.
Your data, your choice
Download sensor history for your own analysis or archive. The VisiblAir privacy statement describes customer ownership and export of sensor data. Public-map visibility is optional per sensor.
Read the Cloud Portal user manual (PDF) · Check service status
Choose a compatible monitor
Models C, E-Lite, O and X2 connect to the Cloud Portal. The available measurements and network options differ by model.
Cloud access: Up to 10 sensors under one account are free. Each additional sensor costs CA$5/month or CA$50/year, plus applicable taxes. Hardware is sold separately. Compare all models.
Watch the 27-second portal tour
The local tour gives a quick view of the dashboard. It has no narration; the dashboard, graph and alert examples above describe its core content. Playback starts only when you choose it.
Text description of the silent tour
The tour shows portal sensor cards with current readings and device status, then historical graphs for examining trends. The static, labeled screenshots above give the same essential information.
Plan your deployment
Compare sensors for a single room or discuss the measurements, connectivity and number of locations needed for a larger project.