One Dashboard for the Whole Sensor Fleet
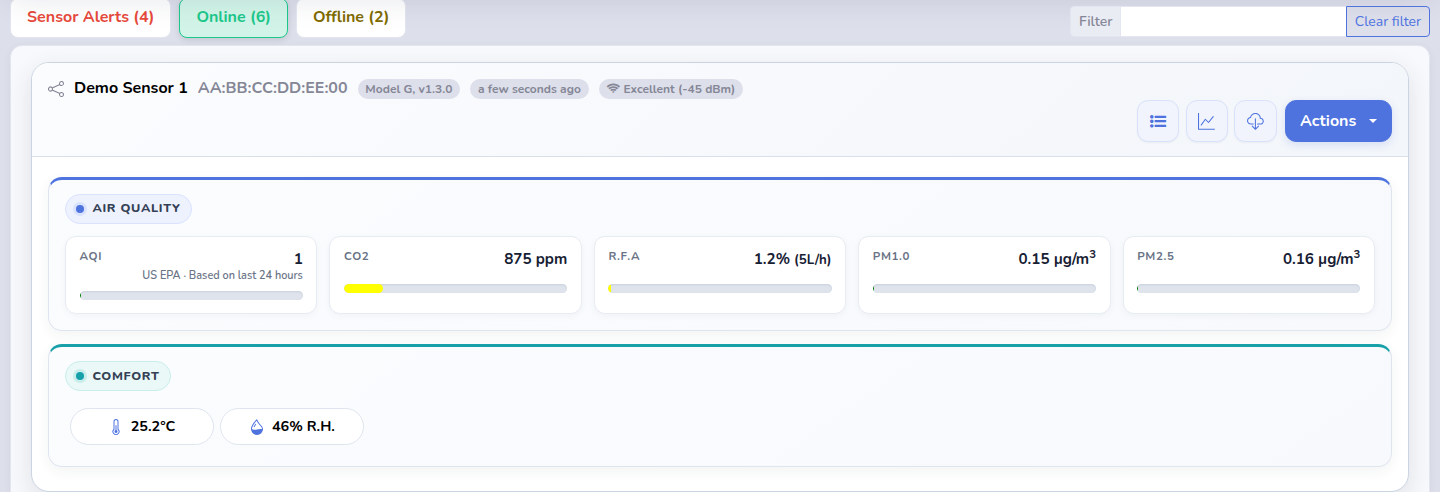
The portal opens with the status of your connected sensors. Separate views make active alerts, online devices and offline devices easy to find, while filtering helps when an account contains several monitors. Each sensor card combines its latest measurements with useful context such as the model, firmware version, last update, network connection and signal quality.
Measurements are grouped into practical categories—including air quality, comfort, gases, particulate matter, water quality, environment and power—when the connected hardware supports them. That keeps a simple indoor monitor readable without limiting more specialized deployments.
See What Changed, Not Just What Is Happening Now
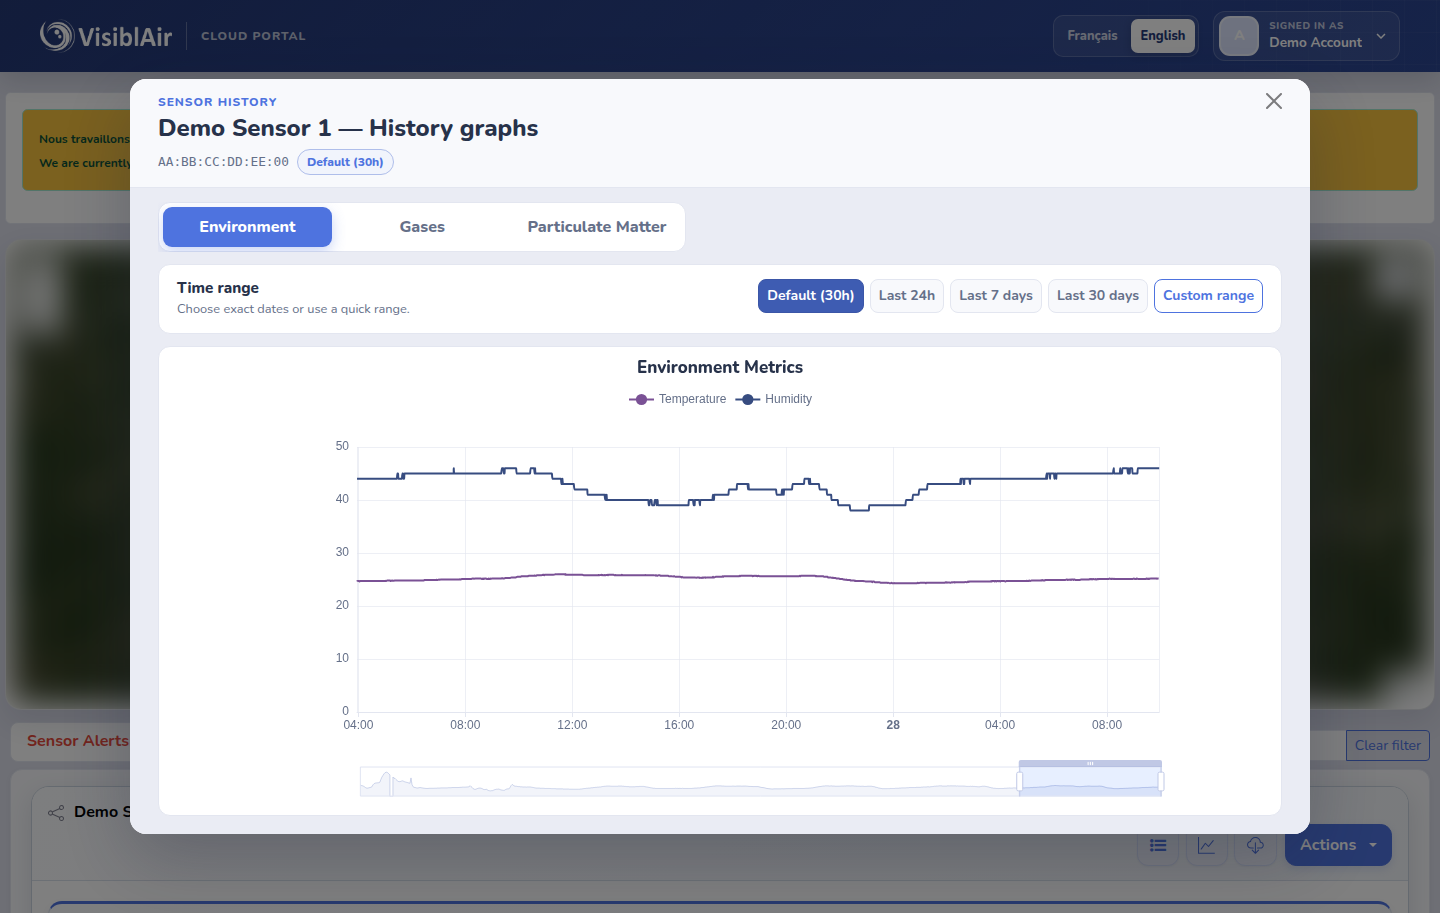
A single reading is a snapshot. Historical graphs reveal the pattern: whether CO2 rises during occupied hours, humidity changes overnight, or particulate matter increases during an outdoor event. The graph workspace separates available measurements into clear groups and offers quick ranges for the last 24 hours, 7 days and 30 days, plus a custom date range.
Interactive zooming, panning and the range navigator make it easier to move from a broad trend to the exact period that deserves attention. This is especially useful when comparing a change in ventilation, filtration, room use or outdoor conditions with the measurements that followed.
Turn Measurements into Timely Alerts
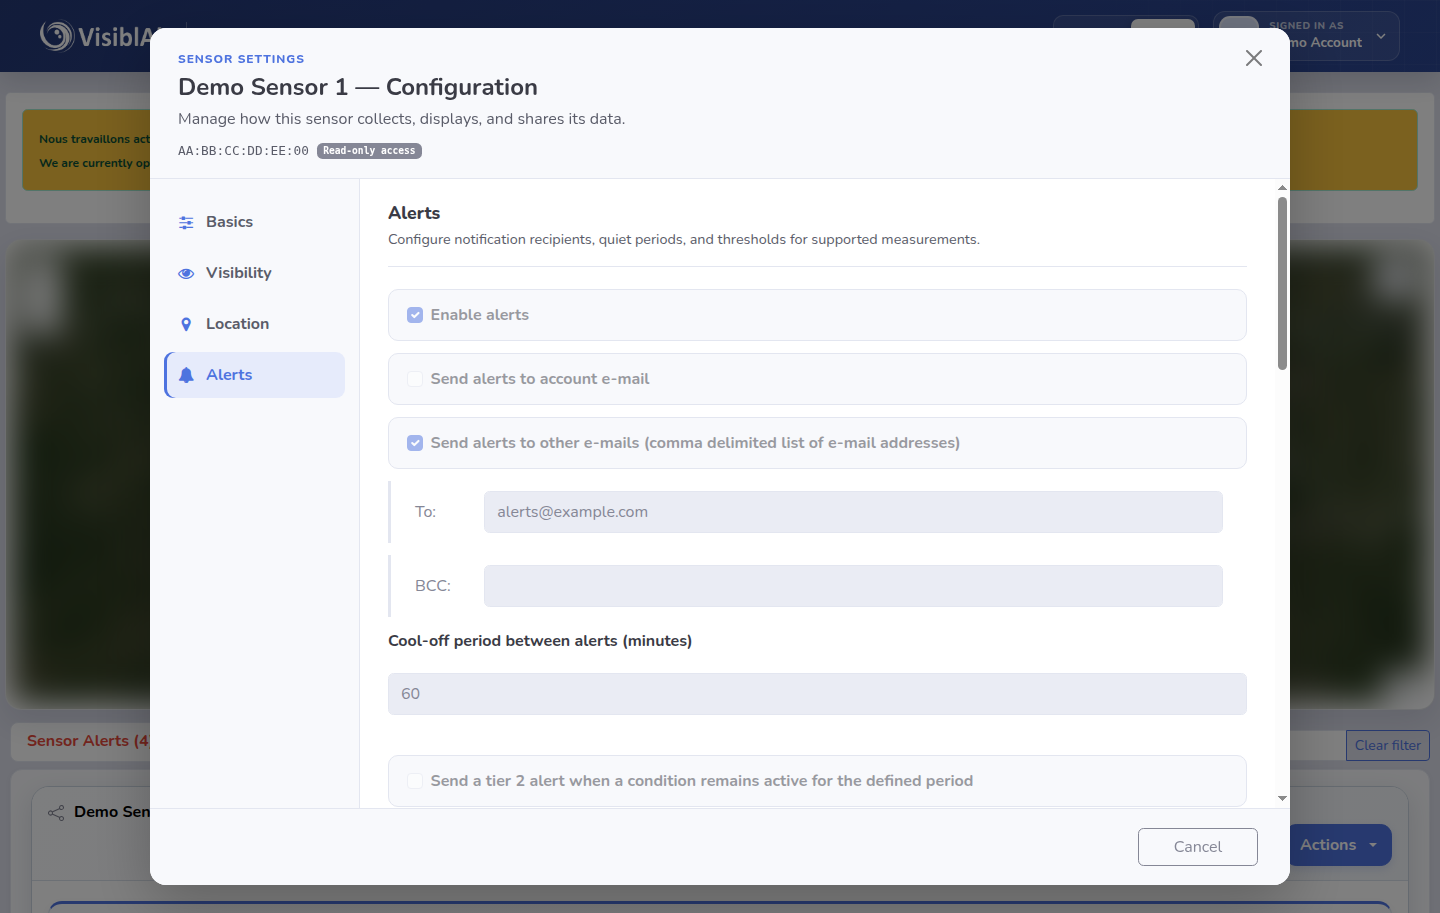
Alerts are configured per sensor, so a classroom, mechanical room and outdoor station can each follow rules suited to their purpose. Supported measurements can trigger above-or-below threshold alerts, and recipients can include the account address, other email addresses and BCC recipients.
The portal also supports cool-off periods to reduce repeated messages, Tier 2 follow-up for persistent conditions, muted weekdays, offline-sensor notifications and PM alert pauses for fog or high humidity. For the full setup logic and current limitations, read How VisiblAir Cloud Portal Alerts Work.
Make Each Sensor View Fit Its Purpose
Choose Which Metrics Stay Visible
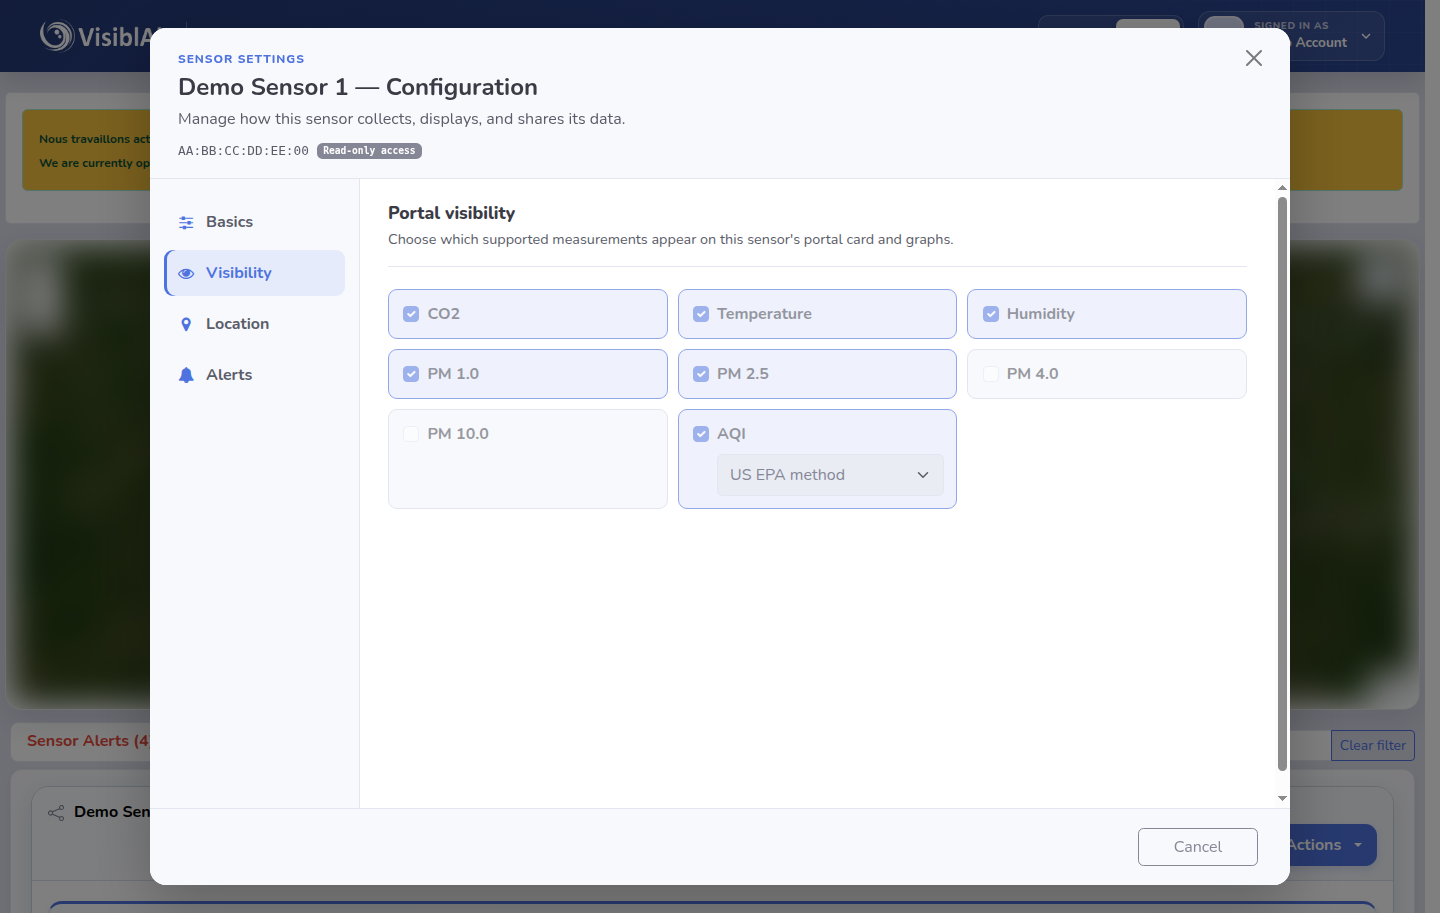
The Visibility tab lets you choose which supported measurements appear on each sensor's portal card and in its graphs. A classroom view can stay focused on CO2, temperature and humidity, while an outdoor station can emphasize AQI and particulate matter. Specialized deployments can surface gas, water-quality, wind or power measurements when the connected model supports them.
This per-sensor control keeps busy dashboards readable and gives each audience the information it needs. The available AQI display can also use the US, Canadian, European, Chinese or Indian calculation method; the detailed differences are covered in How the VisiblAir Cloud Portal Calculates AQI.
Place Each Sensor on the Map
The portal can show sensor cards, a map, or both. This gives multi-site accounts a geographic view of their deployment while preserving a fast path to each sensor's details. Online, offline and alert state can be understood in location context instead of as a list alone.
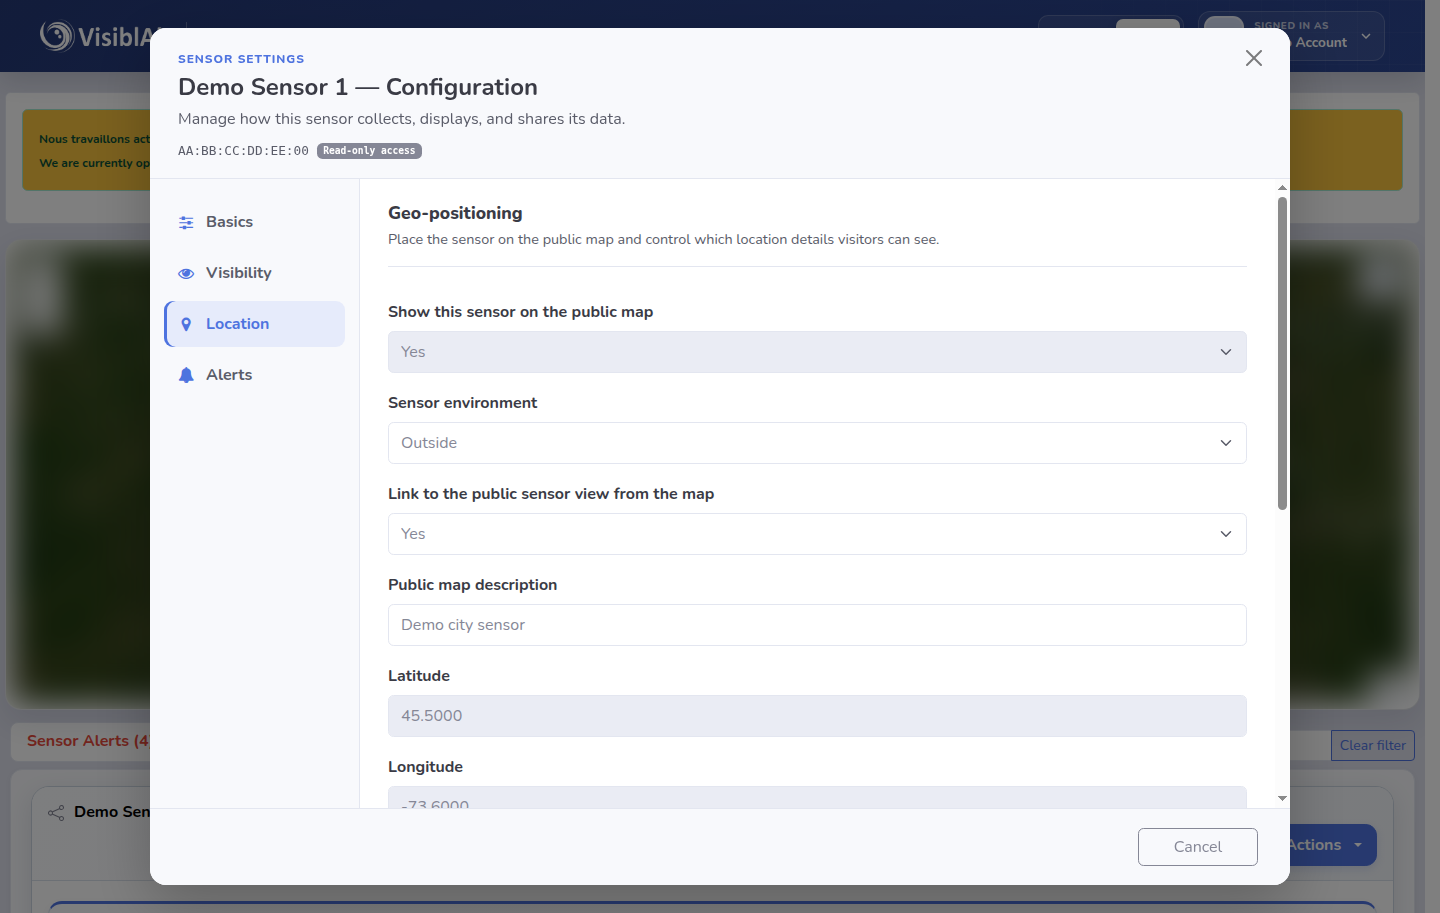
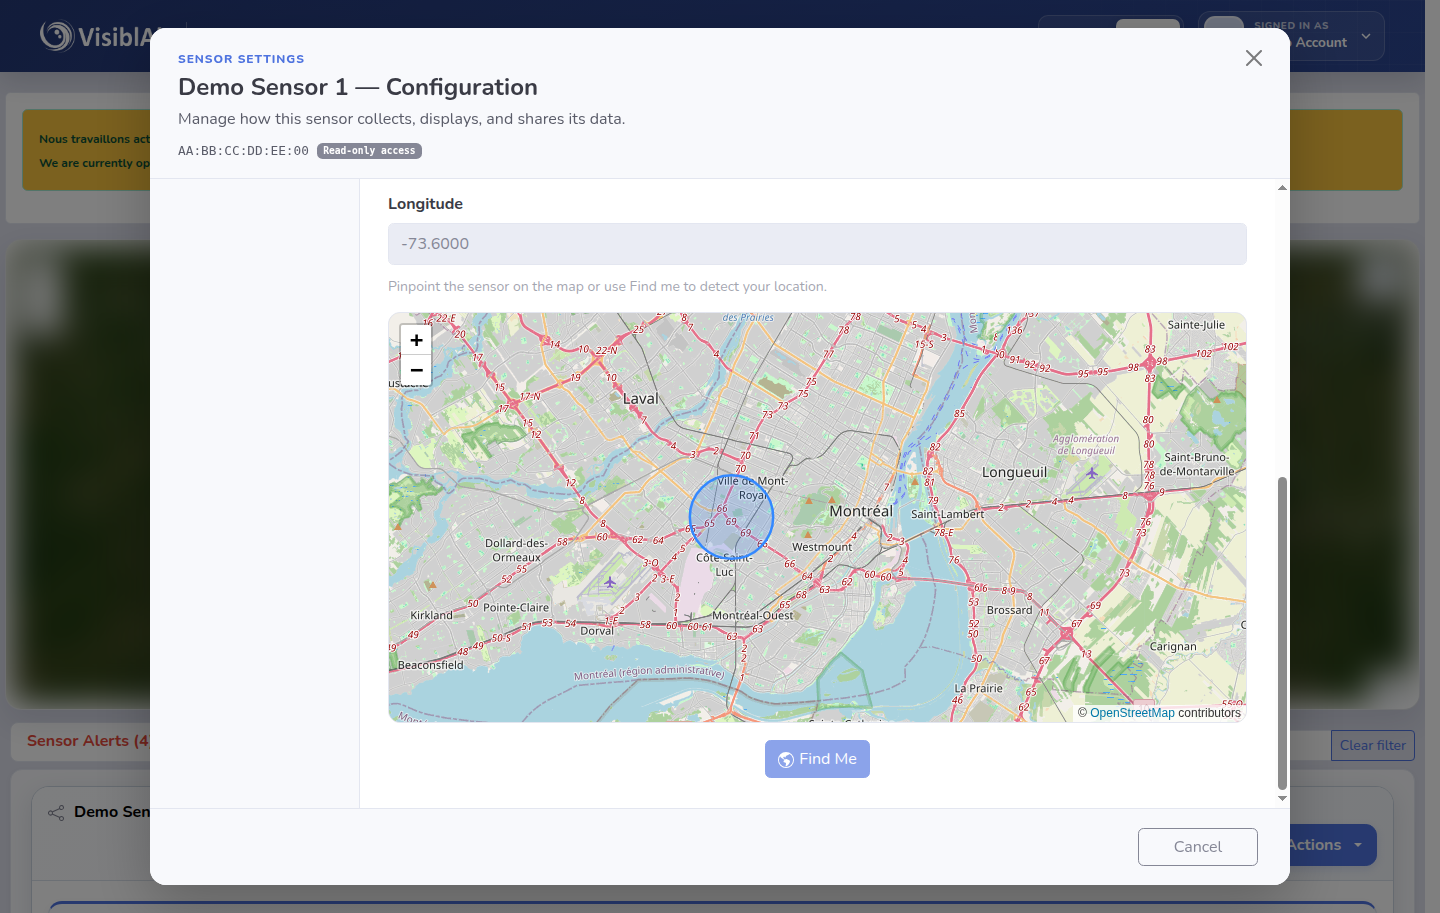
The per-sensor Location tab keeps public-map participation opt-in. It controls whether the sensor appears on the map, whether it is indoors or outdoors, whether visitors can open its public sensor view, and which public description they see. Coordinates can be entered manually, selected directly on the map, or detected with Find Me.
These controls make the map useful without forcing every installation to publish its location. A private indoor deployment can remain off the public map, while an outdoor community monitor can share an appropriate description and public data view.
More Than a Dashboard
Your data stays portable
Download sensor history for your own analysis or archive. VisiblAir's data ownership statement says customer sensor data belongs to the customer and can be exported in standard formats.
Flexible sharing without oversharing
Public views and shared-account access can make selected sensor data useful to others without handing over the main account. Map visibility and public-view links remain separately configurable.
Device tools are close at hand
Depending on the model and account permissions, sensor actions can include recent readings, notes, history downloads, configuration, calibration, firmware information and MQTT settings.
Workspace-level display preferences
Account settings can choose cards, a map, or both; show offline sensors; enable dark mode; and set the default graph period.
Why It Works So Well in Practice
- It shortens the path from reading to action. Current values, trends and alerts live in the same workflow.
- It works for one room or many locations. Fleet status and filters remain useful as more connected sensors are added.
- It preserves context. Device status, firmware, connectivity and measurements can be reviewed together.
- It avoids locking away the measurements. History downloads and data portability support independent analysis.
- It respects customer ownership. The published privacy statement says customer data is stored in Québec and remains the customer's property.
Features follow the connected hardware
Available measurements, configuration tabs and device actions vary by sensor model, firmware and account permissions. Compatible models can continue measuring locally during a Wi-Fi interruption and synchronize stored readings after connectivity returns.
Cloud Access That Can Grow with You
Current VisiblAir connected-product pages include cloud access for up to 10 sensors on one account at no cost. That is enough for a multi-room home, a small office or a classroom pilot, while paid capacity is available for larger fleets.
Start by choosing the measurements and connectivity that fit the site. The product comparison covers connected indoor, Ethernet/PoE and outdoor options. Once a compatible sensor is online, the portal becomes the common place to understand what it measures.
Ready to see your environment more clearly?
Open the portal if you already have a connected VisiblAir sensor, or compare models for your next monitoring project.